Navigation Tips & Tricks

The mPower team is frequently asked about tips they can provide users on quickly navigating NetSuite or searching for information. We have included tips for locating recent records, creating your own shortcuts, performing global searches and monitoring performance details.
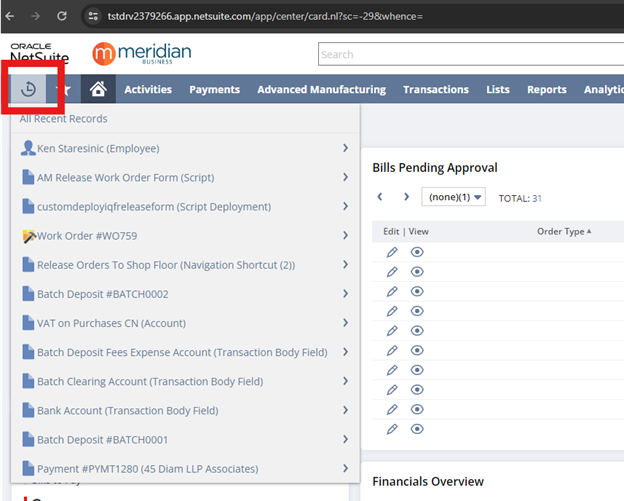
1. Recent Records The recent records search feature (broken clock icon in the upper left corner) is one to remember as most of us need to reference many records and transactions throughout the day. Need to find that work order you looked at earlier today, this is what you would use.
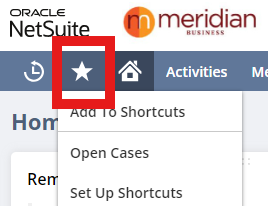
2. Shortcuts Another easy way to save time throughout your day is to make use of the NetSuite shortcuts. They allow users to easily access sites or pages that are commonly used including external sites. They are also helpful reminders for those tasks that are executed less frequently.
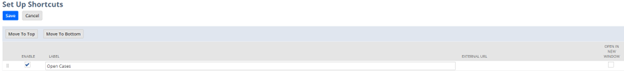
*The shortcuts set up lets you re- order your favorites and gives you an option to open the link in a new window
3. Global Searches or Search Bar
Most of us use the search bar many times throughout the day. (Alt-G is your hotkey to get there). Here are just a few quick tips related to the search bar.
- You can use the abbreviation for the record or transaction that you are looking for to reduce the number of results that you will get
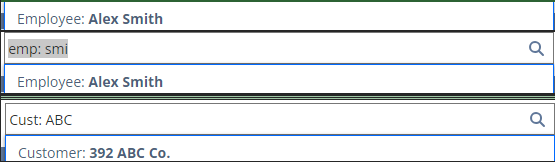
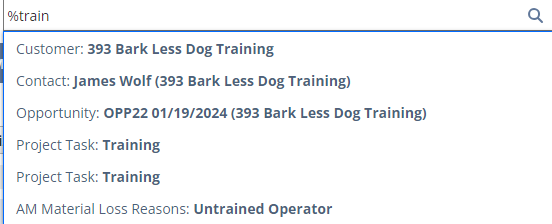
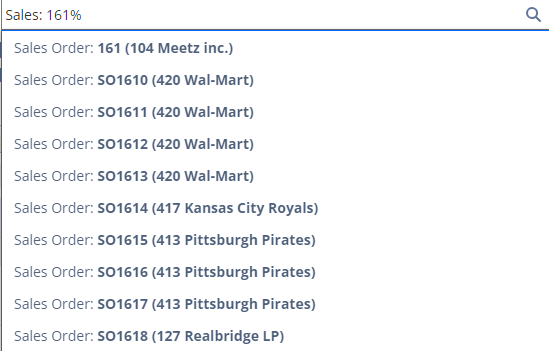
- Use the % wildcard when you’re not 100% sure on the name of your record and again to limit the number results returned. The information below provides an example looking for everything containing a specific word, an example of all sales orders beginning with a specific set of numbers, and an example of how to include inactive records.
*The following results all contain ‘train’.
*This example would be for all sales orders that begin with 161.
- Use the ‘+’ sign to display inactive records.
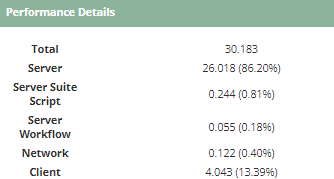
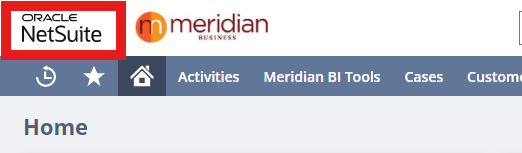
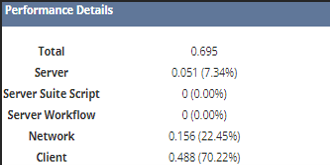
4. Performance Details Page loading too slow or not responding as it should? Double-click on the Oracle NetSuite logo in the upper-left corner and there will be a performance details window that will pop up. The details will show you the total load time in seconds. It can also help point you in the direction with troubleshooting performance issues.
*This is an example where there are no issues with the page load
*Here is an example where you may need to look at any server-side scripts or workflows that are running for this page.